Transforming Data Into Actionable Insights
Building Business Intelligence solutions that empower teams to make data-driven decisions with confidence
The Challenge
In fast-paced organizations, business decisions often rely on fragmented data scattered across multiple systems.
Teams waste time searching for information, reconciling reports manually, and making reactive decisions based on outdated insights.
My goal is to bridge that gap— transforming underutilized data into clear, actionable insights that support better decisions at every level.
The Approach
KPI Definition
Translating business questions into measurable metrics that matter
Data Modeling
Building reliable data structures that connect the dots between systems
Clear Storytelling
Designing dashboards that communicate insights at a glance
Experience
Driving operational efficiency through analytics and decision support
- •Dashboard maintenance and development
- •Forecasting for 24/7 customer service operations
- •Impact: 700+ agents across digital and phone channels
Understanding banking operations and customer needs from the frontline
- •Front-line customer service experience
- •Real-time performance tracking initiative
- •Tool adopted across 350+ agents
Supporting commercial planning through data and reporting
- •Monthly performance reporting
- •Commercial planning support
- •Early responsibility through trust
Across roles, my focus has consistently been on transforming raw, underutilized data into clear, actionable insights that support better decisions—whether at the individual, team, or organizational level.
Education
Bachelor in Business Economics
1st Place
Annual Entrepreneurship Fair (Thesis Presentation) - SeaPack Project
Full Scholarship
Full academic scholarship awarded for the entire degree program
Combining business acumen with technical skills to bridge the gap between strategy and execution
Skills & Expertise
Data Analysis & Visualization
Technical Skills
Business & Domain
Tools & Technologies
Combining technical proficiency with business acumen to deliver data solutions that drive impact
Data Science Salaries Dashboard
An interactive Power BI dashboard exploring salary distribution, market trends, and compensation patterns across the data science field
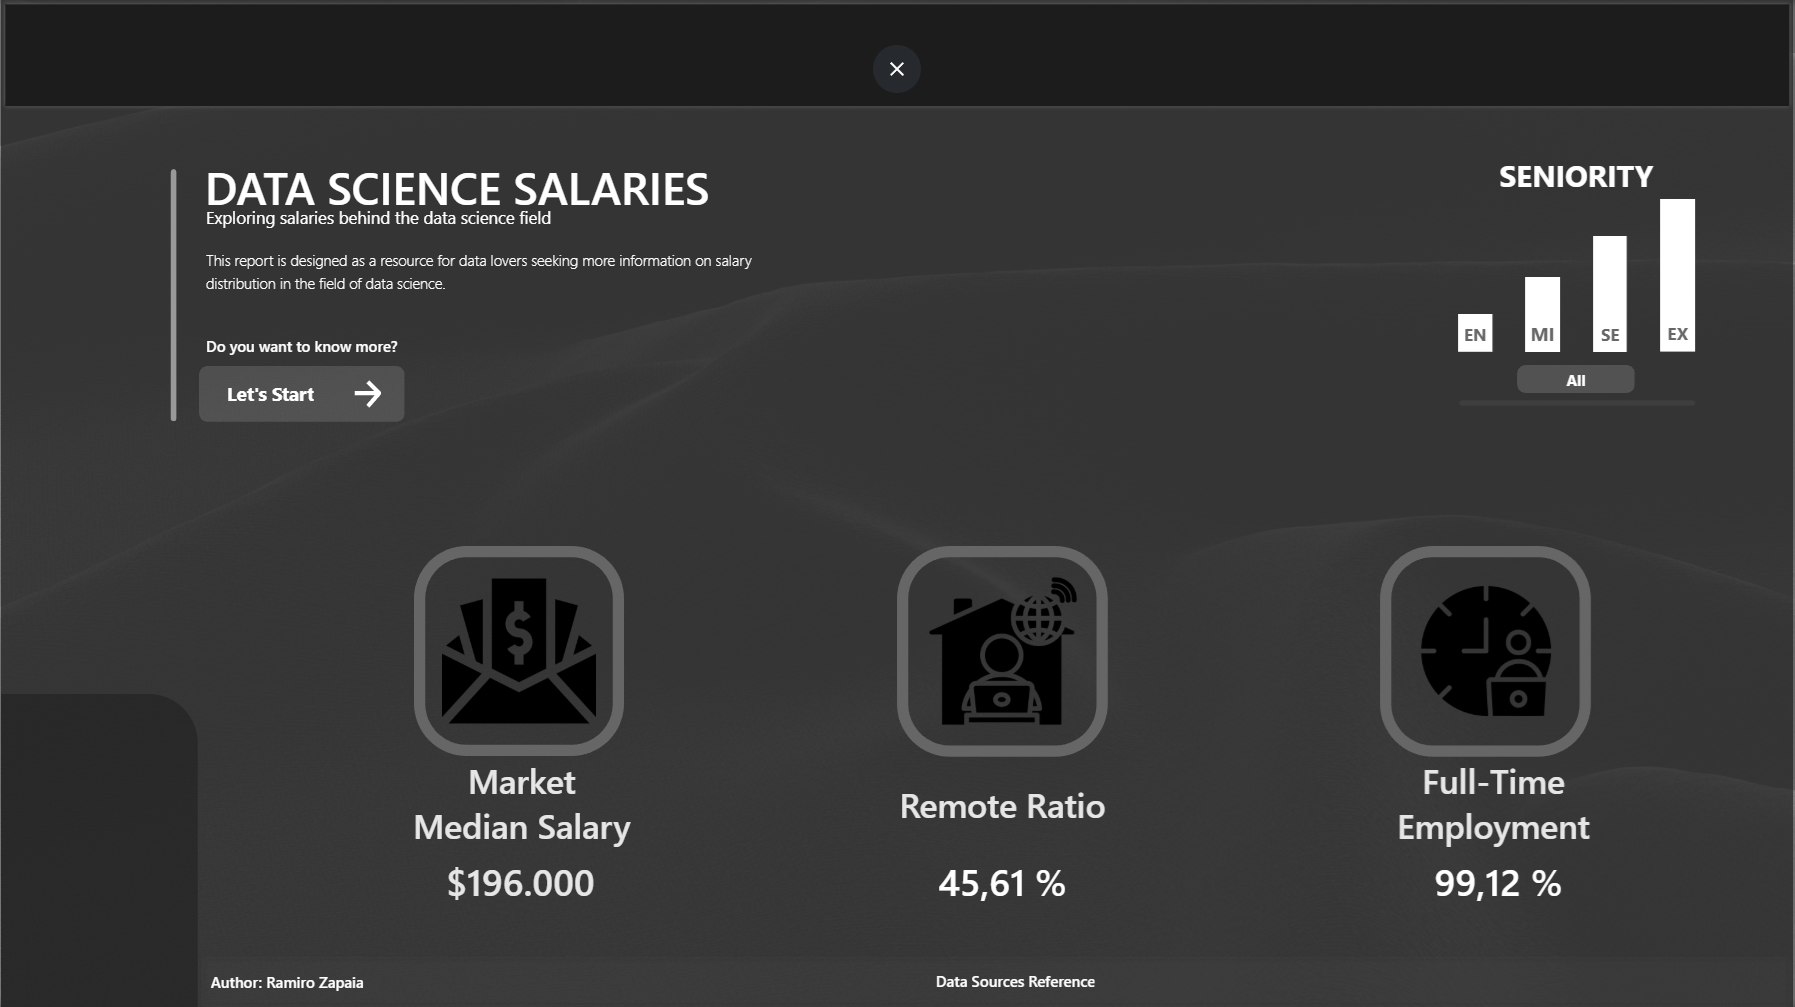
Click on the images to switch between dashboard views
Download the full interactive dashboard from GitHub
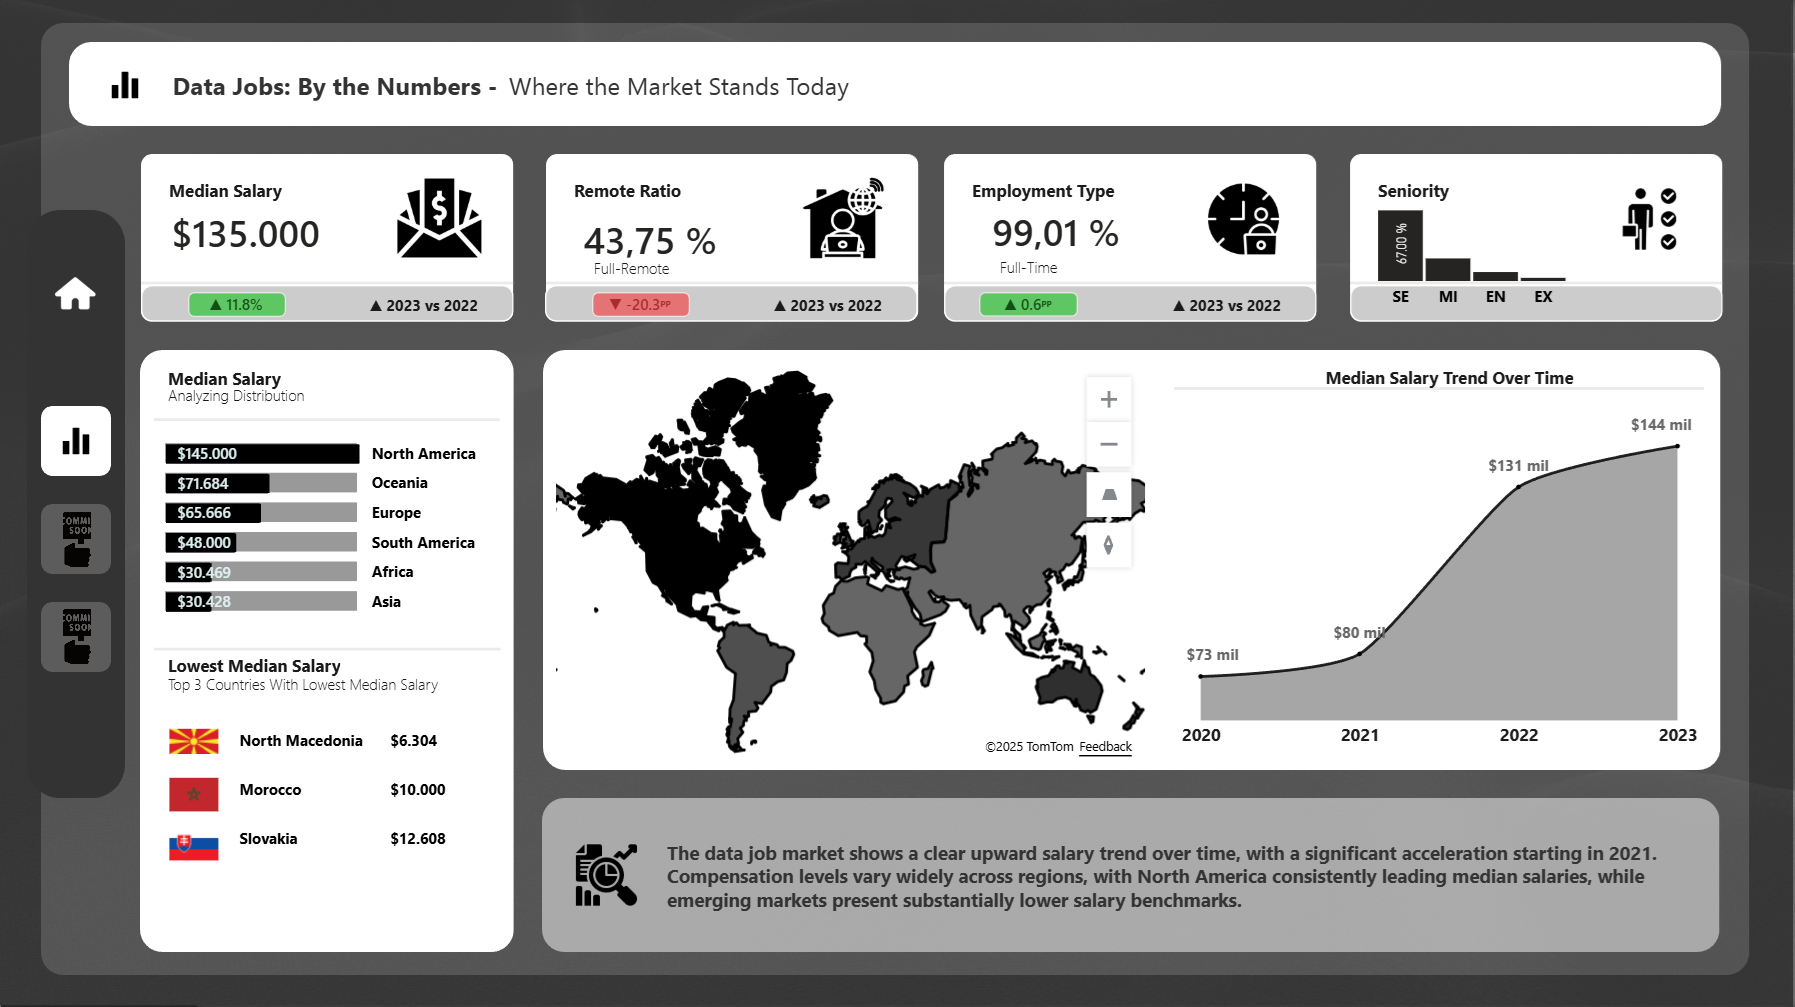
What the Dashboard Reveals
Regional Salary Disparities
North America leads with $145K median salary, while emerging markets like Africa and South America show significantly lower compensation levels, revealing global market dynamics.
Accelerating Salary Growth
The data job market shows clear upward trends from 2020 to 2023, with a notable acceleration in 2021 as companies prioritized data-driven decision making.
Remote Work Evolution
Remote ratio at 43.75% for full-remote positions, down 20.3pp from 2022, indicating a shift back to hybrid and on-site arrangements post-pandemic.
How I Add Value
Translating unclear business questions into measurable KPIs
Improving decision-making processes with timely, accurate data
Supporting teams with actionable insights that drive results
Building data infrastructure that scales with organizational growth
Focus on solving real business problems, not just implementing tools
Let's Work Together
Bachelor in Business Economics with 2+ years of experience in data analytics within the banking industry. Skilled in Power BI, SQL, Excel, and Python, with expertise in data modeling, forecasting, and performance tracking. Passionate about transforming business needs into actionable insights that drive results.
Based in Gold Coast, Australia • Open to remote opportunities